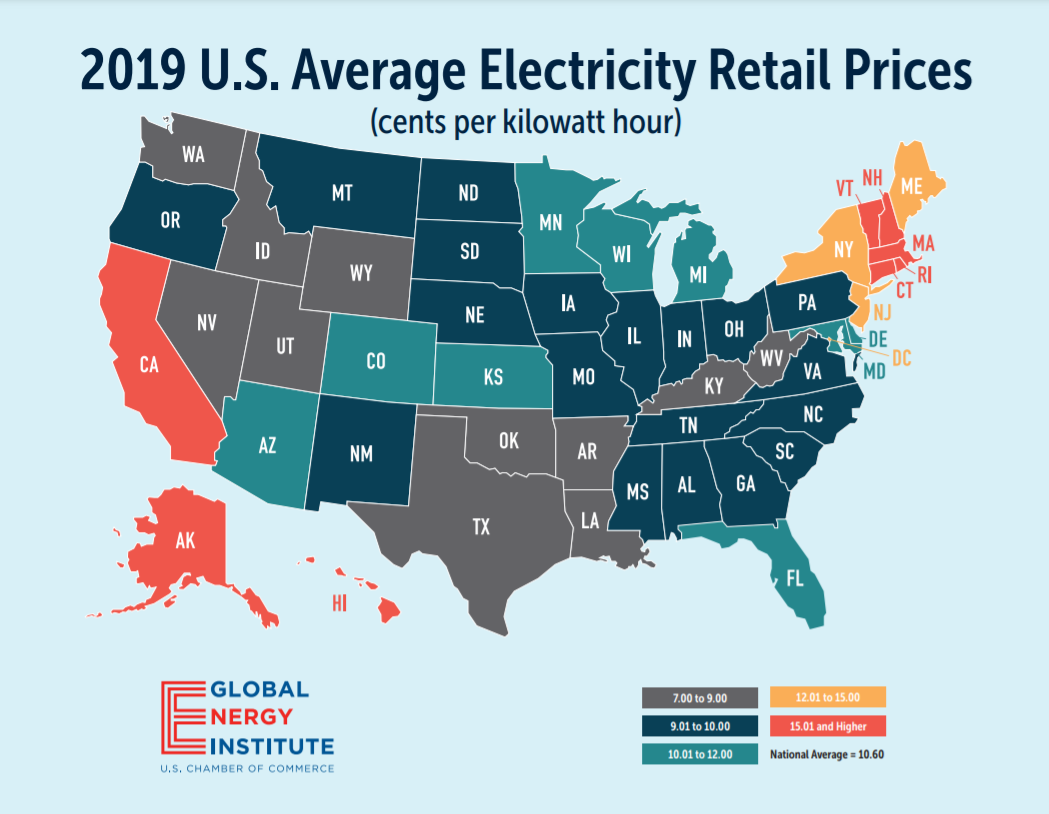
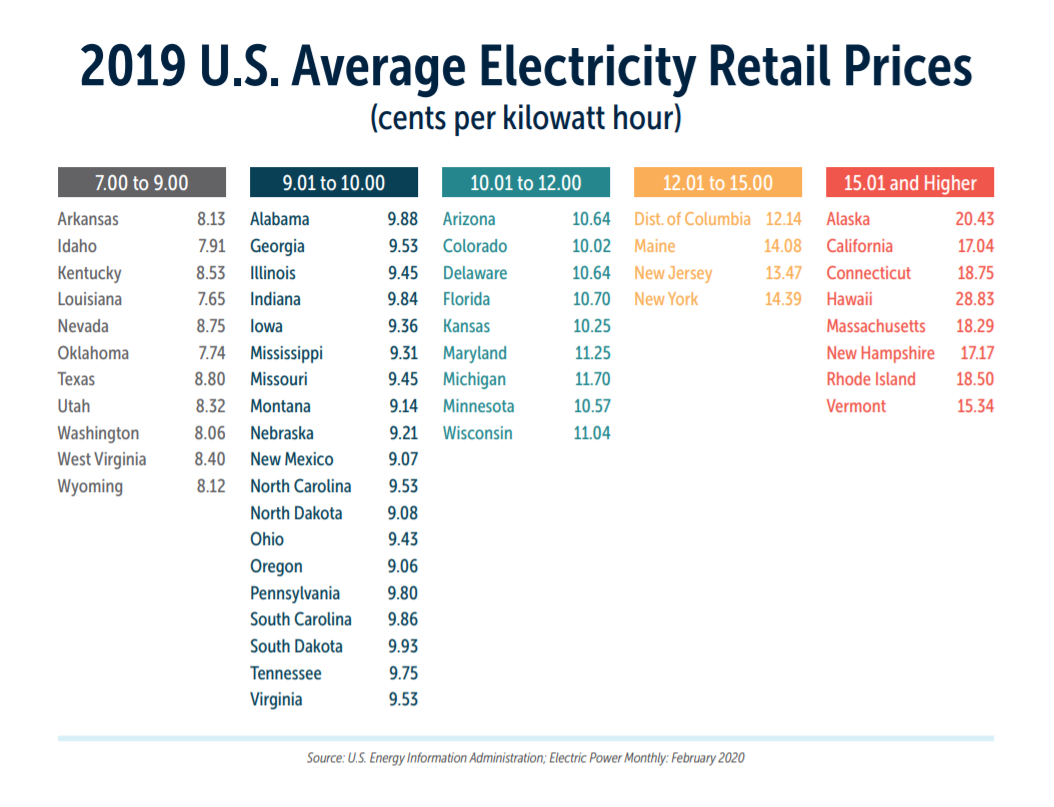
GEI produces an annual updated U.S. electricity price map, showing the 2019 average retail electricity prices across different states, highlighting the significant variations in costs influenced by state energy policies and available energy mixes.
GEI produces an annual updated U.S. electricity price map, showing the 2019 average retail electricity prices across different states, highlighting the significant variations in costs influenced by state energy policies and available energy mixes.
View this online