Stephanie Ferguson Stephanie Ferguson
Director, Global Employment Policy & Special Initiatives, U.S. Chamber of Commerce
Makinizi Hoover Makinizi Hoover
Senior Manager, Strategic Advocacy, U.S. Chamber of Commerce
Isabella Lucy Isabella Lucy
Graphic Designer, U.S. Chamber of Commerce

Published

May 20, 2024

Share

Small businesses employ nearly half of the American workforce and represent 43.5% of America’s GDP. They are a critical part of our economic ecosystem where big businesses and small businesses are vendors, employees, partners, and customers to each other.

 Small businesses fuel the economy.  

  • 99.9%
    of businesses in the U.S. are small businesses
  • 33.2M
    Small businesses in the U.S.
Data from 2023 SBA Office of Advocacy FAQ on Small Business.

Since the late 1990’s, small businesses have accounted for between 43.5% and 50.7% of the United States’ gross domestic output (GDP), which equates to trillions of dollars of economic activity. In 2014, the most recent data available, small businesses generated nearly $5.9 trillion. By comparison, large businesses generated $7.7 trillion to the national GDP that same year.      

Small businesses are big employers. 

  • 45.9%
    of Americans are employed by a small business
  • 61.6M
    Americans are employed by a small business

The majority of small businesses (82%) operate without employees, and those small employers who hire staff employ nearly half of the American workforce. Leading industries for small businesses include professional and business services, financial activities, and wholesale and retail trade, boasting 3.5 to over 7 million businesses within each sector.

The chart below illustrates how businesses contribute millions of jobs over time. For instance, all of the small businesses that employ between 10-19 employees collectively add more than 500,000 jobs to the U.S. economy over 10 years. And small businesses pay big. On average, small businesses pay employees $30.42 an hour, which amounts to a $63,000 income over the course of a year.

Entrepreneurship is booming in the United States. Over the last few years, the number of applications filed to start new businesses has surged. Application numbers doubled in 2020 compared to previous years, and this trend has continued, with over 5 million new business applications filed annually since then. As of April 2024, 1.75 million applications have already been filed this year.

Explore our interactive map below tracking the latest data on the surge in entrepreneurship in each state and county across the country.

New Business Applications by State

Click on a state for more details.

<0
0-15
15.1-30
30.1-45
45.1+

Alabama

  • 0.5%
    The percentage change of new business applications filed in December 2023 compared to December 2022
  • 71,835
    New business applications in 2023
  • #26
    Ranking of 2023 business applications per capita
  • 4,222
    2023 projected business formations within 4 quarters
  • 5.9%
    Percent of applications projected to become an employer business

Alaska

  • -1.8%
    The percentage change of new business applications filed in December 2023 compared to December 2022
  • 8,929
    New business applications in 2023
  • #33
    Ranking of 2023 business applications per capita
  • 795
    2023 projected business formations within 4 quarters
  • 8.9%
    Percent of applications projected to become an employer business

Arizona

  • 5.3%
    The percentage change of new business applications filed in December 2023 compared to December 2022
  • 125,822
    New business applications in 2023
  • #15
    Ranking of 2023 business applications per capita
  • 7,895
    2023 projected business formations within 4 quarters
  • 6.3%
    Percent of applications projected to become an employer business

Arkansas

  • 1.8%
    The percentage change of new business applications filed in December 2023 compared to December 2022
  • 39,048
    New business applications in 2023
  • #34
    Ranking of 2023 business applications per capita
  • 2,764
    2023 projected business formations within 4 quarters
  • 7.1%
    Percent of applications projected to become an employer business

California

  • 7.8%
    The percentage change of new business applications filed in December 2023 compared to December 2022
  • 558,011
    New business applications in 2023
  • #25
    Ranking of 2023 business applications per capita
  • 51,568
    2023 projected business formations within 4 quarters
  • 9.2%
    Percent of applications projected to become an employer business

Colorado

  • 115.0%
    The percentage change of new business applications filed in December 2023 compared to December 2022
  • 142,927
    New business applications in 2023
  • #5
    Ranking of 2023 business applications per capita
  • 7,930
    2023 projected business formations within 4 quarters
  • 5.5%
    Percent of applications projected to become an employer business

Connecticut

  • 10.2%
    The percentage change of new business applications filed in December 2023 compared to December 2022
  • 48,373
    New business applications in 2023
  • #31
    Ranking of 2023 business applications per capita
  • 3,003
    2023 projected business formations within 4 quarters
  • 6.2%
    Percent of applications projected to become an employer business

Delaware

  • 19.3%
    The percentage change of new business applications filed in December 2023 compared to December 2022
  • 55,389
    New business applications in 2023
  • #2
    Ranking of 2023 business applications per capita
  • 2,294
    2023 projected business formations within 4 quarters
  • 4.1%
    Percent of applications projected to become an employer business

District of Columbia

  • -5.6%
    The percentage change of new business applications filed in December 2023 compared to December 2022
  • 14,831
    New business applications in 2023
  • #7
    Ranking of 2023 business applications per capita
  • 589
    2023 projected business formations within 4 quarters
  • 4.0%
    Percent of applications projected to become an employer business

Florida

  • -3.0%
    The percentage change of new business applications filed in December 2023 compared to December 2022
  • 667,031
    New business applications in 2023
  • #3
    Ranking of 2023 business applications per capita
  • 32,523
    2023 projected business formations within 4 quarters
  • 4.9%
    Percent of applications projected to become an employer business

Georgia

  • -9.9%
    The percentage change of new business applications filed in December 2023 compared to December 2022
  • 277,626
    New business applications in 2023
  • #4
    Ranking of 2023 business applications per capita
  • 12,456
    2023 projected business formations within 4 quarters
  • 4.5%
    Percent of applications projected to become an employer business

Hawaii

  • 6.1%
    The percentage change of new business applications filed in December 2023 compared to December 2022
  • 19,159
    New business applications in 2023
  • #29
    Ranking of 2023 business applications per capita
  • 895
    2023 projected business formations within 4 quarters
  • 4.7%
    Percent of applications projected to become an employer business

Idaho

  • 10.1%
    The percentage change of new business applications filed in December 2023 compared to December 2022
  • 31,338
    New business applications in 2023
  • #17
    Ranking of 2023 business applications per capita
  • 2,978
    2023 projected business formations within 4 quarters
  • 9.5%
    Percent of applications projected to become an employer business

Illinois

  • 12.0%
    The percentage change of new business applications filed in December 2023 compared to December 2022
  • 174,667
    New business applications in 2023
  • #27
    Ranking of 2023 business applications per capita
  • 10,880
    2023 projected business formations within 4 quarters
  • 6.2%
    Percent of applications projected to become an employer business

Indiana

  • 13.0%
    The percentage change of new business applications filed in December 2023 compared to December 2022
  • 94,057
    New business applications in 2023
  • #28
    Ranking of 2023 business applications per capita
  • 5,905
    2023 projected business formations within 4 quarters
  • 6.3%
    Percent of applications projected to become an employer business

Iowa

  • 33.7%
    The percentage change of new business applications filed in December 2023 compared to December 2022
  • 33,444
    New business applications in 2023
  • #48
    Ranking of 2023 business applications per capita
  • 2,717
    2023 projected business formations within 4 quarters
  • 8.1%
    Percent of applications projected to become an employer business

Kansas

  • 8.7%
    The percentage change of new business applications filed in December 2023 compared to December 2022
  • 33,268
    New business applications in 2023
  • #42
    Ranking of 2023 business applications per capita
  • 2,659
    2023 projected business formations within 4 quarters
  • 8.0%
    Percent of applications projected to become an employer business

Kentucky

  • 20.0%
    The percentage change of new business applications filed in December 2023 compared to December 2022
  • 55,265
    New business applications in 2023
  • #37
    Ranking of 2023 business applications per capita
  • 3,626
    2023 projected business formations within 4 quarters
  • 6.6%
    Percent of applications projected to become an employer business

Louisiana

  • -8.6%
    The percentage change of new business applications filed in December 2023 compared to December 2022
  • 80,457
    New business applications in 2023
  • #11
    Ranking of 2023 business applications per capita
  • 3,149
    2023 projected business formations within 4 quarters
  • 3.9%
    Percent of applications projected to become an employer business

Maine

  • 26.8%
    The percentage change of new business applications filed in December 2023 compared to December 2022
  • 14,086
    New business applications in 2023
  • #50
    Ranking of 2023 business applications per capita
  • 1,601
    2023 projected business formations within 4 quarters
  • 11.4%
    Percent of applications projected to become an employer business

Maryland

  • 0.5%
    The percentage change of new business applications filed in December 2023 compared to December 2022
  • 101,704
    New business applications in 2023
  • #16
    Ranking of 2023 business applications per capita
  • 4,623
    2023 projected business formations within 4 quarters
  • 4.5%
    Percent of applications projected to become an employer business

Massachusetts

  • 7.0%
    The percentage change of new business applications filed in December 2023 compared to December 2022
  • 76,375
    New business applications in 2023
  • #47
    Ranking of 2023 business applications per capita
  • 7,078
    2023 projected business formations within 4 quarters
  • 9.3%
    Percent of applications projected to become an employer business

Michigan

  • -2.6%
    The percentage change of new business applications filed in December 2023 compared to December 2022
  • 148,508
    New business applications in 2023
  • #24
    Ranking of 2023 business applications per capita
  • 7,445
    2023 projected business formations within 4 quarters
  • 5.0%
    Percent of applications projected to become an employer business

Minnesota

  • 26.3%
    The percentage change of new business applications filed in December 2023 compared to December 2022
  • 69,210
    New business applications in 2023
  • #39
    Ranking of 2023 business applications per capita
  • 4,898
    2023 projected business formations within 4 quarters
  • 7.1%
    Percent of applications projected to become an employer business

Mississippi

  • -6.4%
    The percentage change of new business applications filed in December 2023 compared to December 2022
  • 53,237
    New business applications in 2023
  • #10
    Ranking of 2023 business applications per capita
  • 2,287
    2023 projected business formations within 4 quarters
  • 4.3%
    Percent of applications projected to become an employer business

Missouri

  • 11.7%
    The percentage change of new business applications filed in December 2023 compared to December 2022
  • 90,384
    New business applications in 2023
  • #23
    Ranking of 2023 business applications per capita
  • 6,055
    2023 projected business formations within 4 quarters
  • 6.7%
    Percent of applications projected to become an employer business

Montana

  • 29.5%
    The percentage change of new business applications filed in December 2023 compared to December 2022
  • 23,789
    New business applications in 2023
  • #8
    Ranking of 2023 business applications per capita
  • 1,855
    2023 projected business formations within 4 quarters
  • 7.8%
    Percent of applications projected to become an employer business

Nebraska

  • 11.5%
    The percentage change of new business applications filed in December 2023 compared to December 2022
  • 21,574
    New business applications in 2023
  • #43
    Ranking of 2023 business applications per capita
  • 2,124
    2023 projected business formations within 4 quarters
  • 9.8%
    Percent of applications projected to become an employer business

Nevada

  • 0.6%
    The percentage change of new business applications filed in December 2023 compared to December 2022
  • 65,986
    New business applications in 2023
  • #9
    Ranking of 2023 business applications per capita
  • 4,520
    2023 projected business formations within 4 quarters
  • 6.8%
    Percent of applications projected to become an employer business

New Hampshire

  • 10.1%
    The percentage change of new business applications filed in December 2023 compared to December 2022
  • 16,179
    New business applications in 2023
  • #44
    Ranking of 2023 business applications per capita
  • 1,419
    2023 projected business formations within 4 quarters
  • 8.8%
    Percent of applications projected to become an employer business

New Jersey

  • -1.0%
    The percentage change of new business applications filed in December 2023 compared to December 2022
  • 160,996
    New business applications in 2023
  • #12
    Ranking of 2023 business applications per capita
  • 9,188
    2023 projected business formations within 4 quarters
  • 5.7%
    Percent of applications projected to become an employer business

New Mexico

  • 20.4%
    The percentage change of new business applications filed in December 2023 compared to December 2022
  • 33,865
    New business applications in 2023
  • #18
    Ranking of 2023 business applications per capita
  • 1,760
    2023 projected business formations within 4 quarters
  • 5.2%
    Percent of applications projected to become an employer business

New York

  • 8.1%
    The percentage change of new business applications filed in December 2023 compared to December 2022
  • 313,481
    New business applications in 2023
  • #20
    Ranking of 2023 business applications per capita
  • 22,638
    2023 projected business formations within 4 quarters
  • 7.2%
    Percent of applications projected to become an employer business

North Carolina

  • 6.5%
    The percentage change of new business applications filed in December 2023 compared to December 2022
  • 170,924
    New business applications in 2023
  • #19
    Ranking of 2023 business applications per capita
  • 11,976
    2023 projected business formations within 4 quarters
  • 7.0%
    Percent of applications projected to become an employer business

North Dakota

  • 37.7%
    The percentage change of new business applications filed in December 2023 compared to December 2022
  • 8,960
    New business applications in 2023
  • #40
    Ranking of 2023 business applications per capita
  • 901
    2023 projected business formations within 4 quarters
  • 10.1%
    Percent of applications projected to become an employer business

Ohio

  • 1.9%
    The percentage change of new business applications filed in December 2023 compared to December 2022
  • 148,623
    New business applications in 2023
  • #36
    Ranking of 2023 business applications per capita
  • 7,816
    2023 projected business formations within 4 quarters
  • 5.3%
    Percent of applications projected to become an employer business

Oklahoma

  • 10.9%
    The percentage change of new business applications filed in December 2023 compared to December 2022
  • 58,195
    New business applications in 2023
  • #22
    Ranking of 2023 business applications per capita
  • 3,771
    2023 projected business formations within 4 quarters
  • 6.5%
    Percent of applications projected to become an employer business

Oregon

  • 12.8%
    The percentage change of new business applications filed in December 2023 compared to December 2022
  • 56,662
    New business applications in 2023
  • #32
    Ranking of 2023 business applications per capita
  • 4,778
    2023 projected business formations within 4 quarters
  • 8.4%
    Percent of applications projected to become an employer business

Pennsylvania

  • 13.8%
    The percentage change of new business applications filed in December 2023 compared to December 2022
  • 153,599
    New business applications in 2023
  • #41
    Ranking of 2023 business applications per capita
  • 9,817
    2023 projected business formations within 4 quarters
  • 6.4%
    Percent of applications projected to become an employer business

Rhode Island

  • 3.4%
    The percentage change of new business applications filed in December 2023 compared to December 2022
  • 11,639
    New business applications in 2023
  • #49
    Ranking of 2023 business applications per capita
  • 1,155
    2023 projected business formations within 4 quarters
  • 9.9%
    Percent of applications projected to become an employer business

South Carolina

  • -2.2%
    The percentage change of new business applications filed in December 2023 compared to December 2022
  • 92,138
    New business applications in 2023
  • #13
    Ranking of 2023 business applications per capita
  • 5,384
    2023 projected business formations within 4 quarters
  • 5.8%
    Percent of applications projected to become an employer business

South Dakota

  • 20.6%
    The percentage change of new business applications filed in December 2023 compared to December 2022
  • 11,311
    New business applications in 2023
  • #35
    Ranking of 2023 business applications per capita
  • 1,114
    2023 projected business formations within 4 quarters
  • 9.8%
    Percent of applications projected to become an employer business

Tennessee

  • 8.2%
    The percentage change of new business applications filed in December 2023 compared to December 2022
  • 96,903
    New business applications in 2023
  • #30
    Ranking of 2023 business applications per capita
  • 6,446
    2023 projected business formations within 4 quarters
  • 6.7%
    Percent of applications projected to become an employer business

Texas

  • 4.4%
    The percentage change of new business applications filed in December 2023 compared to December 2022
  • 501,398
    New business applications in 2023
  • #14
    Ranking of 2023 business applications per capita
  • 35,113
    2023 projected business formations within 4 quarters
  • 7.0%
    Percent of applications projected to become an employer business

Utah

  • 21.5%
    The percentage change of new business applications filed in December 2023 compared to December 2022
  • 71,877
    New business applications in 2023
  • #6
    Ranking of 2023 business applications per capita
  • 5,608
    2023 projected business formations within 4 quarters
  • 7.8%
    Percent of applications projected to become an employer business

Vermont

  • 0.2%
    The percentage change of new business applications filed in December 2023 compared to December 2022
  • 7,516
    New business applications in 2023
  • #45
    Ranking of 2023 business applications per capita
  • 645
    2023 projected business formations within 4 quarters
  • 8.6%
    Percent of applications projected to become an employer business

Virginia

  • 2.7%
    The percentage change of new business applications filed in December 2023 compared to December 2022
  • 132,075
    New business applications in 2023
  • #21
    Ranking of 2023 business applications per capita
  • 7,781
    2023 projected business formations within 4 quarters
  • 5.9%
    Percent of applications projected to become an employer business

Washington

  • 6.8%
    The percentage change of new business applications filed in December 2023 compared to December 2022
  • 97,603
    New business applications in 2023
  • #38
    Ranking of 2023 business applications per capita
  • 9,181
    2023 projected business formations within 4 quarters
  • 9.4%
    Percent of applications projected to become an employer business

West Virginia

  • 5.5%
    The percentage change of new business applications filed in December 2023 compared to December 2022
  • 15,297
    New business applications in 2023
  • #51
    Ranking of 2023 business applications per capita
  • 1,025
    2023 projected business formations within 4 quarters
  • 6.7%
    Percent of applications projected to become an employer business

Wisconsin

  • -1.7%
    The percentage change of new business applications filed in December 2023 compared to December 2022
  • 65,409
    New business applications in 2023
  • #46
    Ranking of 2023 business applications per capita
  • 4,318
    2023 projected business formations within 4 quarters
  • 6.6%
    Percent of applications projected to become an employer business

Wyoming

  • 29.5%
    The percentage change of new business applications filed in December 2023 compared to December 2022
  • 58,807
    New business applications in 2023
  • #1
    Ranking of 2023 business applications per capita
  • 2,330
    2023 projected business formations within 4 quarters
  • 4.0%
    Percent of applications projected to become an employer business

Applications Open for the CO—100

The U.S. Chamber of Commerce CO—100 is a list of the top 100 small businesses in America from the world’s largest business organization. 

CO—100 businesses will earn national media exposure, get exclusive access to experts, and tap into one-of-a-kind VIP perks. In addition to these benefits, ten businesses will receive $2,000, and America's Top Small Business of the Year will be awarded $25,000.

Small businesses are innovative.

Small Business Administration (SBA) data shows small businesses have historically applied for a large portion of patents. Businesses with 5-9 employees received more patents per employee than any other business, and nearly double the patents received by large businesses in 2016. That same year, micro employers (1-4 employees) applied for more than 270 patents per employee, or 10% of all patents applied for that year.

Data from 2022 SBA Office of Advocacy Facts: Small Business Innovation Measured by Patenting Activity.

Small business ownership is diverse. 

The innovation and diversity of small businesses reflects the entrepreneurs behind them. Over 40% of small business owners are women, and four in 10 small business owners are foreign-born.

One in five are owned by racial minorities, with Hispanics making up a large portion of that number. In fact, according to the SBA, Hispanic owners are behind one in every four new businesses. Altogether, Hispanic owned businesses pay more than $100 billion in annual payroll across their 1 million workers.

Small businesses are resilient.

Despite facing headwinds including inflation and the ongoing worker shortage crisis, small businesses have proved time and time again that they are resilient.

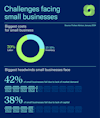
This year, although they remain cautious about the nation’s broader economic outlook,  the majority of small business owners report that their business is in good health, according to the MetLife and U.S. Chamber Small Business Index.

  • 65%
    Small business owners who say their business is in good health
  • 67%
    Small business owners who say they are comfortable with their cash flow

Small businesses are struggling to find and keep good workers.  

The labor shortage is a major headwind small business leaders are facing. There are currently 8.5 million open jobs in the U.S., but only 6.5 million unemployed workers to fill them. 

Forty-one percent of small business leaders have indicated trouble filling job vacancies and over 90% have struggled to find qualified applicants.

Exacerbating the fight to find the right workers, 45% of small businesses say they searched for new talent in 2023, up from 33-36% who said the same in 2021. To attract new talent, small businesses report using a variety of tactics including offering flexible work hours (68%) or offering hybrid or remote working options (48%).

Small businesses are using AI.

The latest edition of the U.S. Chamber’s Empowering Small Business report underscores how various technology platforms play a critical role in helping small businesses navigate challenges—like workforce shortages and inflation—and how small businesses that embrace technology outperform their peers and are more optimistic about the future.

Companies are also looking at emerging technologies like AI to add to their arsenal of digital tools to compete and expand their business. Nearly all (95%) U.S. small businesses report that they use at least one technology platform.

  • 87%
    Small businesses that reported increased efficiency due to technology platforms
  • 1 in 4
    Small businesses using Artificial Intelligence (AI)

Small business owners access capital from many sources to grow their businesses.

Accessing growth capital is a perpetual challenge for small businesses.  Historically, startups and the smallest businesses (0-4 employees) use personal savings to finance their business. 

Businesses in growth-mode and larger small businesses primarily rely on credit cards, community banks, and credit unions to fund their operations. The largest small businesses rely on national banks for growth capital.   

  • 33%
    Businesses launched with less than $5k
  • 58%
    Businesses launched with less than $25k

Small business owners have indicated that financing applications are time-consuming, there is little information available on sources of capital, and that they simply do not qualify for a loan as the most significant barriers to securing financing. 

How the U.S. Chamber supports small business.  

The U.S. Chamber has a longstanding commitment to supporting and advocating for small businesses. We work every day to give small businesses a big voice in Washington, connecting entrepreneurs and federal officials and advocating for policies that help them grow rather than holding them back. 

Our Small Business Council is made up of 100 small business owners from across the country that steer our work in fighting for policies that keep Main Street businesses thriving and regularly visit Capitol Hill. 

Since 2017, we have partnered with MetLife to survey small businesses on a quarterly basis for the Small Business Index, which provides valuable insights on current challenges and opportunities for small business that inform our advocacy in Congress.  

Through our small business platform CO—, which helps almost 20,000 businesses every day and had more than six million site visits last year alone, we are equipping small businesses with the tools and insights they need to ensure their own resilience in the face of any challenge. 

Learn more about the U.S. Chamber small business work here.  For questions regarding small business policy, please contact Tom Sullivan at tsullivan@uschamber.com.

Looking for the latest small business outlook?

Every week the U.S. Chamber's Vice President of Small Business Policy summarizes the latest data and what it means for the health of America's small businesses. 

About the authors

Stephanie Ferguson

Stephanie Ferguson

Stephanie Ferguson is the Director of Global Employment Policy & Special Initiatives. Her work on the labor shortage has been cited in the Wall Street Journal, Washington Post, and Associated Press.

Read more

Makinizi Hoover

Makinizi Hoover

Makinizi Hoover is the Senior Manager of Strategic Advocacy at the U.S. Chamber of Commerce. Her work includes the development and project management of comprehensive data centers that serve as a valuable resource for policymakers, businesses, and the public.

Read more

Isabella Lucy

Isabella Lucy

Isabella has created stunning visualizations tackling pressing issues like the worker shortage, the benefits of hiring veterans, the lifespan of small businesses, and the future of work.

Read more